Markets
Emerging from Bearish Sentiment, Crypto Market Optimism Rises

Bitcoin price rose almost 8% and overcame many obstacles. BTC is now consolidating gains and could correct in the near term towards $65,000.
- Bitcoin started a strong increase and surpassed the $63,500 resistance zone.
- The price is trading above $65,000 and the 100 hourly simple moving average.
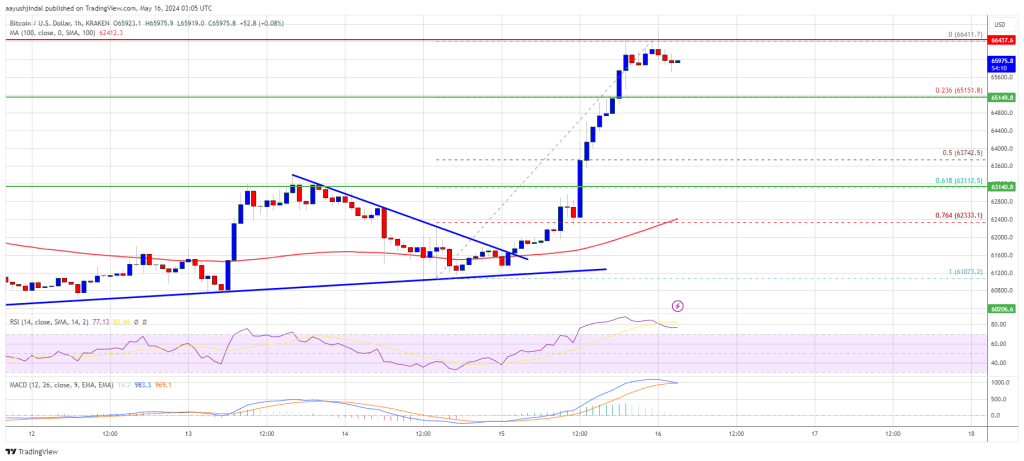
- There was a break above a downtrend line with resistance at $61,500 on the hourly chart of the BTC/USD pair (data feed from Kraken).
- The pair may correct gains, but bulls may be active near $65,000 and $64,500.
Bitcoin price rises 8%
Bitcoin price remained strong above the $60,000 support zone. BTC formed a base and started a new increase above the $62,000 level. There was a break above a downtrend line with resistance at $61,500 on the hourly chart of the BTC/USD pair.
The pair rose more than 6% and broke many obstacles near the Resistance at $63,500. It even surpassed the $65,500 resistance. A new weekly high was formed at $66,411 and the price is now consolidating gains.
It is holding gains above the 23.6% Fibonacci retracement level of the recent wave from the $61,073 swing low to $66,411 high. Bitcoin price is also trading above $65,000 and the 100 hour simple moving average.
Immediate resistance is near the $66,400 level. The first major resistance could be at $66,850. The next key resistance could be at $67,200. A clear move above the $67,200 resistance could push the price higher. In this case, the price could rise and test the $68,000 resistance.
Source: BTCUSD on TradingView.com
If there is a close above the $68,000 resistance zone, the price could continue rising. In the stated case, the price could rise to $70,000.
Are dips limited in BTC?
If Bitcoin fails to rise above the $66,400 resistance zone, it could initiate a downside correction. Immediate downside support is near the $65,150 level.
The first major support is at $64,500. If there is a close below $64,500, the price could start falling towards $63,500 or the 50% Fibonacci retracement level of the recent wave from the $61,073 swing low to the $66,411 high. Further losses could send the price towards the $63,000 support zone in the near term.
Technical indicators:
Hourly MACD – The MACD is now gaining pace in the bullish zone.
Hourly RSI (Relative Strength Index) – The RSI for BTC/USD is now above the 50 level.
Key support levels – $65,150, followed by $64,500.
Key resistance levels – $66,400, $66,800 and $67,200.