News
How far will Ethereum (ETH) go?

2.30pm ▪ 10 minute reading ▪ by Thomas A.
Crypto bull markets generally benefit altcoins in a second phase. In May, Ethereum (ETH) recorded a performance of more than 15%, and almost 65% since the beginning of the year. This resurgence of Ethereum comes after the SEC approved the establishment of ETFs on the world’s second largest cryptocurrency. Although the correlation between Bitcoin and Ethereum remains high, the cyclicality of Ethereum’s price appears to be operating with the same precision in the structure of this bull market. Decoding Ethereum Price Indicators and Dynamics.
An ETF soon to revive the market?
As with Bitcoin (BTC), the US Securities and Exchange Commission has approved the establishment of an ETF on Ethereum. Therefore, this decision will allow major global managers to expand the cryptocurrency offering to their clients. However, the SEC has yet to approve its marketing…
“This follows the successful introduction of Bitcoin ETFs in January, which quickly attracted $13.3 billion in net inflows, setting performance records for ETFs upon their launch. The arrival of ETFs on Ethereum could be similarly successful, attracting a new inflow of capital to the second largest cryptocurrency.”
This same announcement for Bitcoin had particularly favored the increase in prices to all-time highs. The arrival of an ETF on Ethereum therefore leaves the potential for a return to the November 2021 highs of $4,868. In May 2024, ETH therefore represents almost 17.7% of the market capitalization. This market share is still far behind Bitcoin, with a dominance close to 53%.
The approval of ETFs on Ethereum could therefore trigger a catch-up effect compared to Bitcoin. Furthermore, these ETFs could also be used in the future to create ETFs representing a basket of cryptocurrencies.
A look at fractals: the rise persists
An important indicator to measure the feasibility of the trend on ETH is the use of fractals. In fact, the Hurst exponent (to know more) allows you to measure the degree of persistence of the trend from one time scale to another. Furthermore, the Hurst exponent is ideally between 0 and 1. With Ethereum, a Hurst exponent close to 1 indicates significant upside potential and consequently good symmetry with important lows. Conversely, a Hurst exponent close to 0 will indicate that the trend is anti-persistent and will likely turn downward.
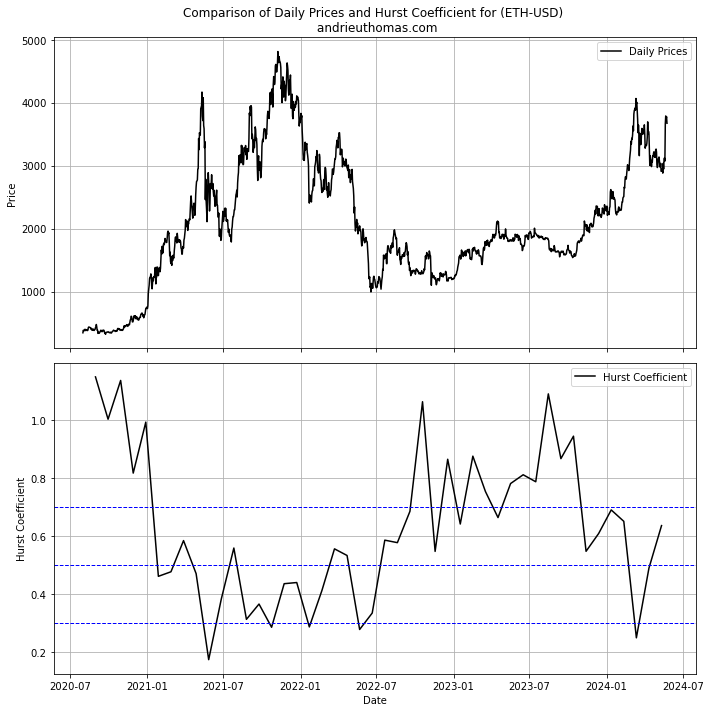

Graphically, we see that ETH gained significant upside potential in mid-2022, reconfirming it in early 2023. The resulting bull market, according to the theory, was accompanied by a decrease in the Hurst exponent, signaling the loss of upside potential. In March 2024, the Hurst exponent was below 30%, indicating downside risk, or at least the absence of upside potential. However, Ethereum’s recent rebound appears to reaffirm a renewal of upside potential, thus limiting the downside risks seen in Spring 2024.
Nonetheless, this approach encourages us to be more cautious about the nature of the bull market with respect to 2023. Indeed, it seems clear that the bull market has exhausted a significant portion of its overall potential.
The cycles that act on ETH
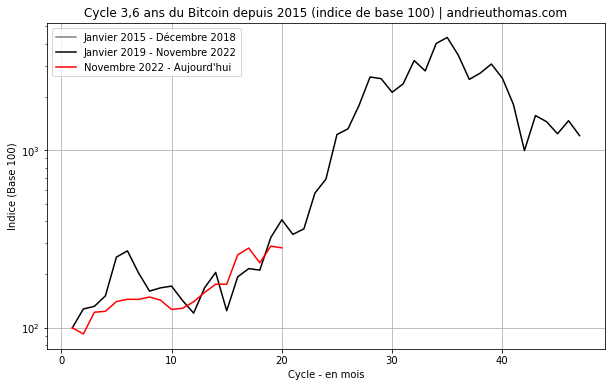
In several articles we have had the opportunity to highlight a cycle close to 3.6 years on Ethereum. Furthermore, this ruling cycle corresponds to the same ruling cycle as Bitcoin (BTC). The timing of this cycle therefore allows us to judge and compare different bull or bear markets. For examplethe bull market observed on Bitcoin since 2023 is highly symmetrical to previous bull markets.
“In fact, we know that two cycles of 4 and 22 months synchronized in February 2018. We are now looking for the time period needed to make the next constructive interference happen. Calculating the LCM(4,22), we get 44 months (3.6 years)which is strongly correlated to the cyclicality of stocks and Bitcoin (Cyclicality of Bitcoin (BTC) – Cointribune).”
Technical indicators: constructive interference and destructive interference – Cointribune
Just over 3.6 years therefore separate the major peak of 2018 from that of 2021 on Ethereum. Likewise, 3.6 years separates the early 2019 main bottom from the mid-2022 main bottom, etc. We see a clear cyclical dynamic here, fueled mainly by the correlation of Ethereum with Bitcoin. From this perspective, certainly theoretical, we could expect Ethereum to peak around mid-2025. Finally, we will mention the good symmetry observed so far between the current bull market and the previous bull market.

ETH remains correlated with Bitcoin
In our previous document, we highlighted the importance of the correlation between Ethereum and Bitcoin. The minimums and major minimums of the cryptocurrency market are in fact linked to the relationship that exists between the two main cryptocurrencies.
“We note in our case that a high correlation coefficient between Bitcoin and Ethereum is favorable for the translation of important lows on Bitcoin. Conversely, a low correlation coefficient (very low coefficient) will likely translate a strong weakening of market strength and major peaks. One major explanation could be that, during bull markets, the dependence of altcoins on Bitcoin decreases.”
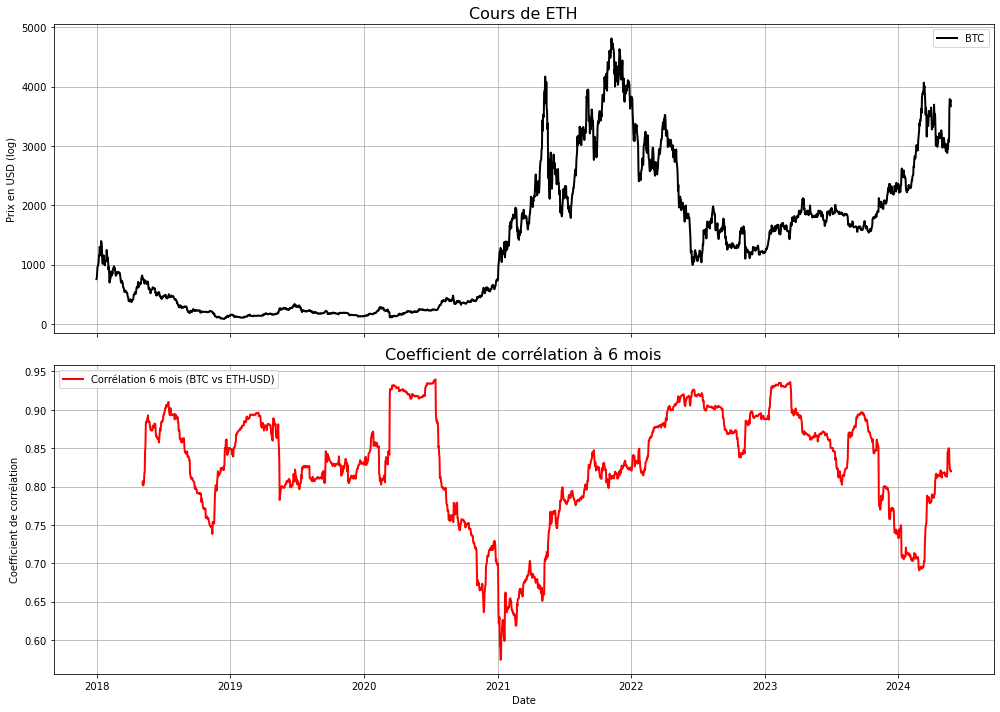

Graphically, we can verify that the important lows on ETH are connected by a very high correlation with Bitcoin. However, ahead of the major bull markets on ETH, we note that the BTC/ETH correlation is minimal. In March 2024 the 6-month correlation between Bitcoin and Ethereum therefore reached a minimum of around 70%. By symmetry, this effectively signaled the likely arrival of an intense bull market on ETH. The study of the correlation between the two assets, however, does not allow us to effectively judge the probable maximums of Ethereum.
Despite everything, we see that the correlation between the two assets remains generally high. It’s mostly above 80%, which is significant.
Towards $6,000?
The Technical Analysis of the price of Ethereum can provide us with further elements. In fact, we note that the consolidation of March/April 2024 does not compromise the bullish trend that began in 2023. On the contrary, the recent bullish breakout allows us to set an initial target (almost reached) towards the recent highs around $4,000.
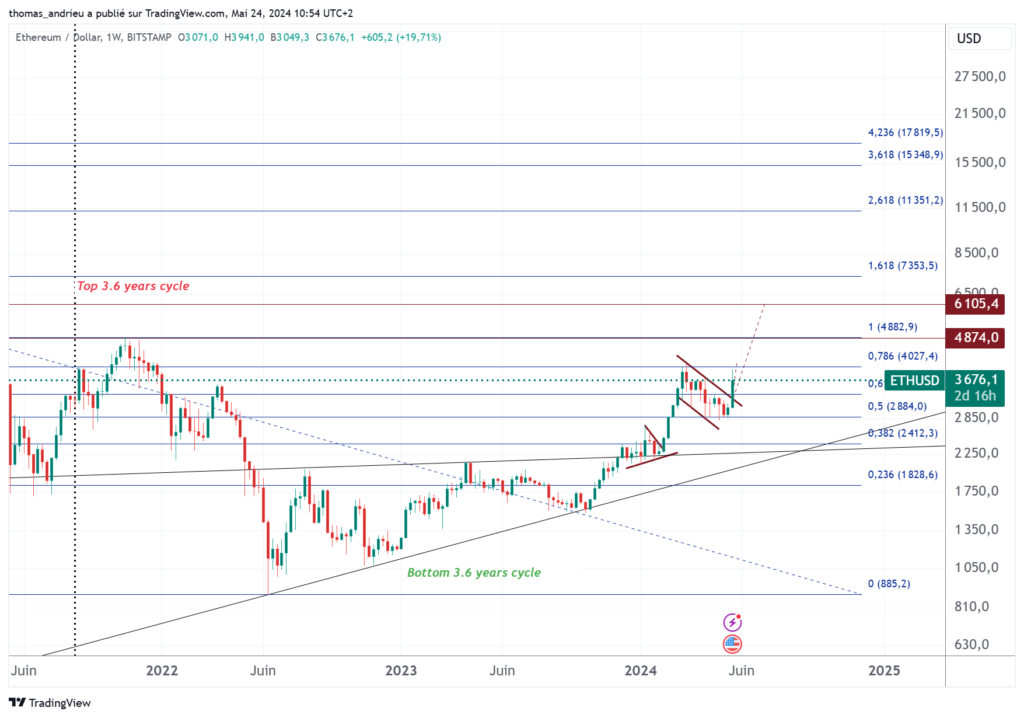

Then, as we have highlighted, it would be consistent, given the correlation with Bitcoin, to reach historical highs at $4,800. In the continuation of this theoretical bullish move, the next extended target of the consolidation pattern (flag, logarithmic scale) would be near $6,000. This level doesn’t look graphically or statistically impossible. On the contrary, continued difficulties in breaking out of recent highs, or a prolonged drop below $3,000, would signal a likely exit from the uptrend.
We also mentioned the good timing of this dynamic, similar to that of Bitcoin. However, we see that a continued upward trend would have less basis than the 2023 and early 2024 increase. This necessarily encourages greater attention to indicators of market strength.
In short
The approval of Ethereum ETFs appears to have triggered a break in the consolidation since March. The bullish trend on Ethereum continues thus:
- With an extension of demand to ETFs and the rebound in the price of Bitcoin.
- A weakening of the bullish strength in terms of fractals. However, the upside potential appears to be maintained in April/May regarding the price rebound.
- Furthermore, the timing and cyclicality of the market still seems relevant. So far, a certain symmetry persists between the current bull market and the previous one. The bullish dynamic is therefore accompanied by structural market cycles.
- Correlation with Bitcoin is maintained despite a decorrelation in March 2024. This signal indicates that the bull market on ETH is likely to continue in line with Bitcoin.
- Finally, technical analysis clearly shows continuation potential. Targeting previous highs, then historical highs, would then be likely in a bull market. If the bullish strength is maintained, some extended targets are around $6,000, and above by extension.
Maximize your Cointribune experience with our “Read to Earn” program! Earn points for every article you read and access exclusive rewards. Sign up now and start earning benefits.
Click here to sign up to “Read to Earn” and turn your passion for cryptocurrencies into rewards!


Thomas A.
Author of various books, financial and economic editor for numerous websites, I have developed a true passion for the analysis and study of markets and the economy.
DISCLAIMER
The views, thoughts and opinions expressed in this article are solely those of the author and should not be relied upon as investment advice. Do your research before making any investment decisions.