Markets
Bitcoin Cash (BCH) Price Surges 27% Amid $9 Billion Mt.Gox Media Frenzy
Bitcoin Cash price rebounded above $368 on July 11, marking a 23% recovery from last week’s bottom. On-chain data shows how increased media traction from Mt.Gox payments could further fuel the rally.
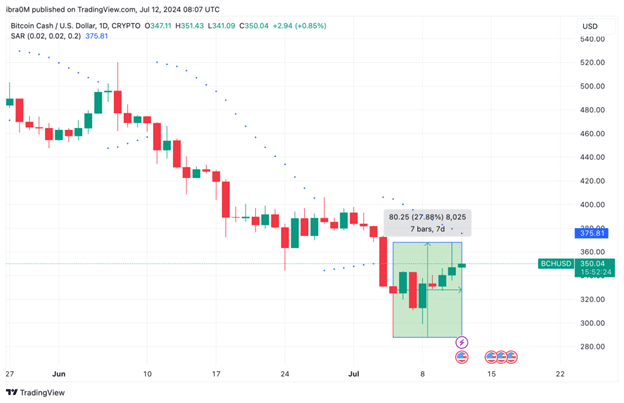
Bitcoin Cash Jumps 27%, Printing 4 Consecutive Green Candles
In the first week of July, the global cryptocurrency market suffered intense FUD (Fear, Uncertainty and Doubt), triggered by a German government sell-off and $9 billion payments to Mt Gox creditors denominated in Bitcoin and Bitcoin Cash.
Bearish headwinds from these events sent BTC and BCH tumbling to all-time lows during widespread market sell-offs on July 5. However, since then, buying momentum has gradually returned to BCH markets again amid dovish jobs reports and inflation data published by U.S. authorities this week.

The graph above illustrates how Bitcoin Cash has been on a steady upward trend since the U.S. nonfarm payrolls data was released on July 5.
At the time of writing on Friday, July 12, the price of BCH is trading above the $350 level, having risen as high as $368 in the 24-hour period. Furthermore, BCH has now printed 3 consecutive green candles, a move that affirms the bulls’ strength in the short-term market momentum.
Mt Gox links boosted BCH on trend charts
When it was announced that the $9 billion payments to Mt Gox creditors would be made in BTC and BCH, it triggered widespread short-term selling, as expected. But as market FUD dies down amid positive macroeconomic reports from the US this week, the media buzz generated by the Mt Gox payments may be pushing BCH prices higher.
The IntoTheBlock chart shows daily trends in Bitcoin Cash (BCH) hits on relevant search engines like Google. An increasing search trend usually implies increased interest from existing investors or discovery by potential new entrants, and vice versa.
The chart above shows that the search score for “BCH” was 46 on July 7. But as Bitcoin Cash’s involvement in Mt Gox payments dominated the news, there was a significant increase in Google users’ search results for information about BCH.
At the time of publication on July 12, BCH’s research score has risen to 67, reflecting a 46% increase in the last 5 days alone.
Historically, increased research interest in a specific asset often leads to increased demand from both existing investors and new users who may discover the project on trending charts.
Unsurprisingly, the 46% increase in BCH’s search score over the past five days coincided with a 27% price jump. Therefore, as bulls regain control of the crypto markets following positive U.S. economic indices in July, rising search trends could propel BCH price further towards the $400 level in the coming weeks.
BCH Price Prediction: Bumpy Road to $400
Bitcoin Cash (BCH) is currently trading at $349.47, showing a slight increase of 0.68% over the past day. The price has experienced a notable recovery of 27.88% over the past week, signaling a potential uptrend. Auto Fib Extension levels provide a clear roadmap for BCH’s price action, highlighting key resistance and support levels.
The immediate resistance for BCH lies at $360.46, matching the 0.236 Fib retracement level. A break above this resistance could propel the price towards the next significant resistance at $406.18, the 0.0 Fib level, marking a potential target of $400.
If BCH can maintain its momentum and break these resistance levels, it could pave the way for a more prolonged rally.
On the downside, key support levels are crucial to maintaining the bullish outlook. The first support level to watch is at $338.98, the 0.382 Fibonacci retracement level. A drop below this level could lead to a retest of the support at $318.22, the 0.5 Fibonacci level. If BCH fails to hold these support levels, it could signal a reversal and a move towards minor support at $297.46, the 0.618 Fibonacci level.
In summary, Bitcoin Cash is showing promising signs of recovery with the potential to reach the $400 mark. Traders should closely monitor the resistance levels at $360.46 and $406.18. On the other hand, holding the support at $338.98 and $318.22 is crucial to sustain the bullish momentum. A break above the key resistance could signal a strong upward move, while failure to hold the support could lead to a bearish reversal.
Disclaimer: This content is informative and should not be considered financial advice. The views expressed in this article may include the personal views of the author and do not reflect the views of The Crypto Basic. Readers are encouraged to do thorough research before making any investment decisions. The Crypto Basic is not responsible for any financial losses.
-Announcement-