Markets
Bitcoin Cash (BCH) Price Surges 27% Amid $9 Billion Mt.Gox Media Frenzy
Bitcoin Cash price rebounded above $368 on July 11, marking a 23% recovery from last week’s bottom. On-chain data shows how increased media traction from Mt.Gox payments could further fuel the rally.
Bitcoin Cash Jumps 27%, Printing 4 Consecutive Green Candles
In the first week of July, the global cryptocurrency market suffered intense FUD (Fear, Uncertainty and Doubt), triggered by a German government sell-off and $9 billion payments to Mt Gox creditors denominated in Bitcoin and Bitcoin Cash.
Bearish headwinds from these events sent BTC and BCH tumbling to all-time lows during widespread market sell-offs on July 5. However, since then, buying momentum has gradually returned to BCH markets again amid dovish jobs reports and inflation data published by U.S. authorities this week.
 Bitcoin Cash BCHUSD Price Action | TradingView
The graph above illustrates how Bitcoin Cash has been on a steady upward trend since the U.S. nonfarm payrolls data was released on July 5.
At the time of writing on Friday, July 12, the price of BCH is trading above the $350 level, having risen as high as $368 in the 24-hour period. Furthermore, BCH has now printed 3 consecutive green candles, a move that affirms the bulls’ strength in the short-term market momentum.
Mt Gox links boosted BCH on trend charts
When it was announced that the $9 billion payments to Mt Gox creditors would be made in BTC and BCH, it triggered widespread short-term selling, as expected. But as market FUD dies down amid positive macroeconomic reports from the US this week, the media buzz generated by the Mt Gox payments may be pushing BCH prices higher.
The IntoTheBlock chart shows daily trends in Bitcoin Cash (BCH) hits on relevant search engines like Google. An increasing search trend usually implies increased interest from existing investors or discovery by potential new entrants, and vice versa.
 Bitcoin Cash Price vs BCH Search Trend | IntoTheBlock
The chart above shows that the search score for “BCH” was 46 on July 7. But as Bitcoin Cash’s involvement in Mt Gox payments dominated the news, there was a significant increase in Google users’ search results for information about BCH.
At the time of publication on July 12, BCH’s research score has risen to 67, reflecting a 46% increase in the last 5 days alone.
Historically, increased research interest in a specific asset often leads to increased demand from both existing investors and new users who may discover the project on trending charts.
Unsurprisingly, the 46% increase in BCH’s search score over the past five days coincided with a 27% price jump. Therefore, as bulls regain control of the crypto markets following positive U.S. economic indices in July, rising search trends could propel BCH price further towards the $400 level in the coming weeks.
BCH Price Prediction: Bumpy Road to $400
Bitcoin Cash (BCH) is currently trading at $349.47, showing a slight increase of 0.68% over the past day. The price has experienced a notable recovery of 27.88% over the past week, signaling a potential uptrend. Auto Fib Extension levels provide a clear roadmap for BCH’s price action, highlighting key resistance and support levels.
The immediate resistance for BCH lies at $360.46, matching the 0.236 Fib retracement level. A break above this resistance could propel the price towards the next significant resistance at $406.18, the 0.0 Fib level, marking a potential target of $400.
If BCH can maintain its momentum and break these resistance levels, it could pave the way for a more prolonged rally.
 Bitcoin Cash Price Prediction | BCHUSD
On the downside, key support levels are crucial to maintaining the bullish outlook. The first support level to watch is at $338.98, the 0.382 Fibonacci retracement level. A drop below this level could lead to a retest of the support at $318.22, the 0.5 Fibonacci level. If BCH fails to hold these support levels, it could signal a reversal and a move towards minor support at $297.46, the 0.618 Fibonacci level.
In summary, Bitcoin Cash is showing promising signs of recovery with the potential to reach the $400 mark. Traders should closely monitor the resistance levels at $360.46 and $406.18. On the other hand, holding the support at $338.98 and $318.22 is crucial to sustain the bullish momentum. A break above the key resistance could signal a strong upward move, while failure to hold the support could lead to a bearish reversal.
Disclaimer: This content is informative and should not be considered financial advice. The views expressed in this article may include the personal views of the author and do not reflect the views of The Crypto Basic. Readers are encouraged to do thorough research before making any investment decisions. The Crypto Basic is not responsible for any financial losses.
-Announcement-
This week saw $722 million worth of Bitcoin spot ETF inflows, including the largest daily inflow in a month.
Cryptocurrency markets rallied on Wednesday, driven by inflows into spot Bitcoin exchange-traded funds (ETFs).
The price of Bitcoin (BTC) is up 3% over the past 24 hours to last change hands at $65,200, according to CoinGecko. Ethereum (ETH) is up 2% and is trading at $3,471. Solana (SUN) and Polkadot (POINT) increased by 4%.
Bitcoin spot ETFs saw $422 million in daily inflows on Tuesday, the highest in the past 30 days, according to Far side data, . The all-time record for a single day was $1.05 billion on March 12.
Among Tuesday’s top contributors, BlackRock’s IBIT led with $260 million in inflows, followed by Fidelity’s FBTC with $61 million. This week has already seen more than $722 million in inflows.
Among the top 100 cryptocurrencies by market cap, Worldcoin (WLD) led with a 28% increase, followed by Helium (HNT) with 20% and Lido DAO (LDO) with 15%.
Worldcoin, a decentralized identity project led by OpenAI CEO Sam Altman, announced is extending the lockups for early investors and team members. This means that tokens will be gradually released through 2029, instead of the original 2027 plan. Token unlocks are generally seen as a negative because they increase supply and early investors can sell their tokens for profit.
Meanwhile, XRP, the token of the XRP Ledger network, jumped 8% after the CME and CF benchmarks introduced new indices and reference rates for XRP.
U.S. stocks faced a downturn on Wednesday. The S&P 500 fell 1%, while the Nasdaq Composite and Dow Jones Industrial Average both fell 2%.
Markets
Altcoins on the cusp of a major breakout – WLD, AR, and INJ prices could surge by 20% in the coming days

Crypto markets appear to have been taken over by the bulls as major tokens have surged above their crucial resistance zone. Bitcoin surged above $65,000 while Ethereum was above $3,500, and XRP, which had remained passive for quite some time, surged over 40% in the past few days to hit $0.6. The uptrend has been captured in most altcoins, with Worldcoin (WLD), Arweave (AR), and Injective (INJ) leading the rally. Here’s what to expect for these tokens in the coming days.
Worldcoin (WLD) Price Analysis
O Worldcoin Price has been trading inside a descending wedge since it marked a new ATH near $12 in the final days of Q1 2024. The recent price action helped the price break out of the upper resistance of the wedge, breaking above the crucial resistance zone between $2.21 and $2.39. Market sentiments have changed, but technicals suggest that the bulls may remain passive for a while, which could offer some room for a bearish pullback.

The price broke out of the wedge with a significant increase in volume, but the current volume suggests that the bulls have taken a step back. Meanwhile, the RSI is about to reach the upper boundary, which could attract bearish forces. Additionally, the DMI has undergone a bullish crossover, but the decline in the ADX suggests that the rally may remain consolidated above the gains. Therefore, the WLD price is expected to maintain a horizontal consolidation between $3 and $3.3 and trigger a fresh rally to $4.4 during the next bullish rally.
Arweave (AR) Price Analysis
Arweave formed a strong base around $25, which helped the rally trigger a recovery during the bearish attack. Mt. Gox and German terror forced the price to fall below $20. However, the recent price action has brought the altcoin within the bullish range and raised expectations of maintaining a decent uptrend for a few more days.
AR price has hit one of the major resistances around $30 to $31.5, which could act as a strong base once overcome. The buying volume is slowly increasing, which could keep the bullish hopes for the rally high. Moreover, the supertrend has just flashed a buy signal, indicating a clean reversal of the trend. Therefore, AR price seems primed to maintain a healthy uptrend and rally above $40. However, if the bulls maintain a similar trend, making new highs above $50 may not be a tedious task for the bulls.
Price Analysis of Injective (INJ)
Injective price has been showing sharp strength since the beginning of the year and hence, the recent turnaround is expected to revive a good uptrend going forward. The bears engulfed the rally to a large extent, but the recent price action suggests that the bulls have regained their dominance. Therefore, INJ price is expected to maintain a strong uptrend with a bearish interference on the way down.
INJ price has surged above the lower support zone and has registered consecutive bullish candles. Although the volume is below the required levels, the OBV is maintaining a sharp uptrend. Furthermore, the Ichimoku cloud lead span B is heading towards the lead span A and a healthy crossover indicates the start of a new uptrend. However, INJ price may be out of the bears’ reach once it secures the resistance zone between $30.77 and $32.12, which seems to be on the horizon.
Ethereum (ETH) supply on exchanges has hit a 34-month high as the asset’s price surpassed the $3,500 mark.
ETH has risen 2.3% over the past 24 hours and is trading at $3,490 at the time of writing. The second-largest cryptocurrency — with a market cap of $419 billion — briefly touched an intraday high of $3,517 earlier today.
ETH Price, Whale Activity, RSI, and Exchange Supply – July 17 | Source: Santiment
Ethereum’s daily trading volume also increased by 7.6% to reach $19.8 billion.
According to data provided by Santiment, the supply of Ethereum on exchanges has reached $19.52 million ETH. This level was last seen in September 2021, when the asset was trading around the same price.
On the other hand, data from the market intelligence platform shows that the number of whale transactions has fallen by 12% in the last day — falling from 8,730 to 7,629 unique transactions per day.
The move shows that the supply of Ethereum on exchanges has been increasing with small deposits rather than large transactions from whales.
Additionally, the ETH Relative Strength Index (RSI) is currently hovering at the 60-mark, per Santiment. The indicator shows that Ethereum is slightly overbought at this price point, but it may not be in a critical position due to its large market cap.
One of the main drivers of Ethereum price increase is ETH spot expectations ETFs in the US Investment products are scheduled to start trading on July 23rd.
Markets
Bits + Beeps: How to Play the ‘Trump Trade’ in Cryptocurrencies After the Assassination Attempt
Also, how much will the Fed cut rates (and when)? What will be the inflows into ETH ETFs? And what is the near future for Bitcoin?
Posted on July 17, 2024 at 12:00 PM EST.
Listen to the episode at Apple Podcasts, Spotify, Capsules, Source, Podcast Addict, Pocket molds, Amazon Musicor on your favorite podcast platform.
In this episode of Bits + Bips, hosts James Seyffart, Alex Kruger and Joe McCann, joined by guest Jack Platts, dive into the market reaction to the recent assassination attempt on former President Donald Trump, analyzing how this event will influence the 2024 US presidential election and the cryptocurrency markets.
They also cover potential rate cuts: Could there be a cut in July? How big could the September rate cut be? Could the decision be influenced by the upcoming election?
They also give their predictions on what percentage of BTC ETF inflows the ETH ETFs will reach, and James talks about what he expects for Grayscale’s ETHE (hint: his outlook would be positive for ETH).
Finally, they delve into what’s next for Bitcoin as the German government runs out of BTC and Mt. Gox distributions begin. Just now?
Program Highlights:
- Whether Trump’s shooting decided the election and whether the event caused a “flight to safety”
- How election markets are becoming a place to watch election probabilities and whether cryptocurrencies “lean right”
- Whether rate cuts will occur in July or September and by how much they will cut: 25 bps or 50 bps
- How Joe sees the relationship between global liquidity cycles, rate cuts, and the potential rise of Bitcoin
- What are the new updates about Ethereum ETFs and their expected launch?
- Why Solana Hasn’t Performed Significantly Better Since Trump News
- What Market Breadth Indicates About the Current Market Rally and the Impact of Rates on Small Caps
- Everyone’s predictions on ETH ETF inflows and how much outflow we’ll see on Grayscale’s ETHE
- What’s Next for BTC After German Government Exits Bitcoin and Mt. Gox Giveaways Starting This Week
Hosts:
Guest:
- Jack PlattsCo-Founder and Managing Partner of Hypersphere Ventures

JACK MALLERS -“What is coming in August is bigger than a bull race”

Forget the CBDC! This is the greatest threat to your financial freedom: Whitney Webb and Mark Goodwin

“Final warning! I won’t say it anymore!” – Michael Saylor 2025 Bitcoin forecast

Fred Thiel – The cryptocurrency market is flashing a signal that has never flashed before

Jeff Booth – “We are entering a storm for which nobody is prepared!”

DeFi Technologies Appoints Andrew Forson to Board of Directors

US Agencies Request Information on Bank-Fintech Dealings

Block Investors Need More to Assess Crypto Unit’s Earnings Potential, Analysts Say — TradingView News

Switchboard Revolutionizes DeFi with New Oracle Aggregator

Is Zypto Wallet a Reliable Choice for DeFi Users?
JACK MALLERS -“What is coming in August is bigger than a bull race”
Forget the CBDC! This is the greatest threat to your financial freedom: Whitney Webb and Mark Goodwin
“Final warning! I won’t say it anymore!” – Michael Saylor 2025 Bitcoin forecast
Fred Thiel – The cryptocurrency market is flashing a signal that has never flashed before
Jeff Booth – “We are entering a storm for which nobody is prepared!”
-
 DeFi12 months ago
DeFi Technologies Appoints Andrew Forson to Board of Directors
-
 Fintech12 months ago
US Agencies Request Information on Bank-Fintech Dealings
-
 News1 year ago
Block Investors Need More to Assess Crypto Unit’s Earnings Potential, Analysts Say — TradingView News
-
 DeFi12 months ago
Switchboard Revolutionizes DeFi with New Oracle Aggregator
-
 DeFi12 months ago
Is Zypto Wallet a Reliable Choice for DeFi Users?
-
 News1 year ago
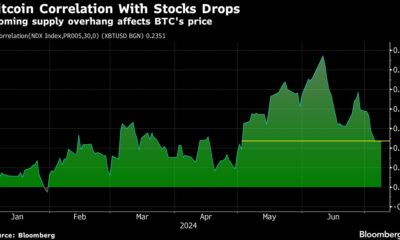
Bitcoin and Technology Correlation Collapses Due to Excess Supply
-

 Fintech12 months ago
What changes in financial regulation have impacted the development of financial technology?
-
 Fintech12 months ago
Scottish financial technology firm Aveni secures £11m to expand AI offering
-
 Fintech12 months ago
Scottish financial technology firm Aveni raises £11m to develop custom AI model for financial services
-

 News1 year ago
ValueZone launches new tools to maximize earnings during the ongoing crypto summer
-

 Videos6 months ago
“Artificial intelligence is bringing us to a future that we may not survive” – Sco to Whitney Webb’s Waorting!
-

 DeFi1 year ago
TON Network Surpasses $200M TVL, Boosted by Open League and DeFi Growth ⋆ ZyCrypto